Figure 7.

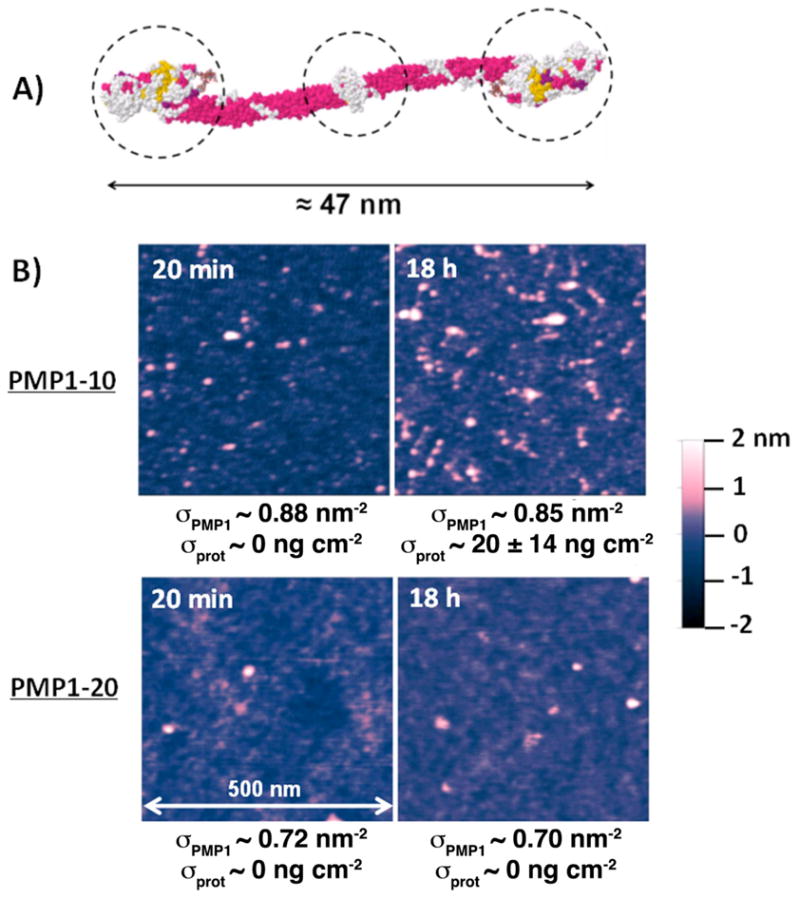
A) Space-filling molecular model of fibrinogen. The dashed lines indicate the overall 3-lobed profile of the protein. B) AFM tapping mode images of PMP1-10 and PMP1-20 brush coated TiO2 surfaces after immersion in fibrinogen solutions for the indicated durations. Individual adsorbed fibrinogen proteins were identified by their 3-lobed profiles (triple protrusions in close proximity to each other). All images show scan areas of 500×500 nm2. The brush densities of each sample and the measured fibrinogen adsorption are indicated under each panel. The samples were rinsed in ultra-pure water and then imaged in air.
