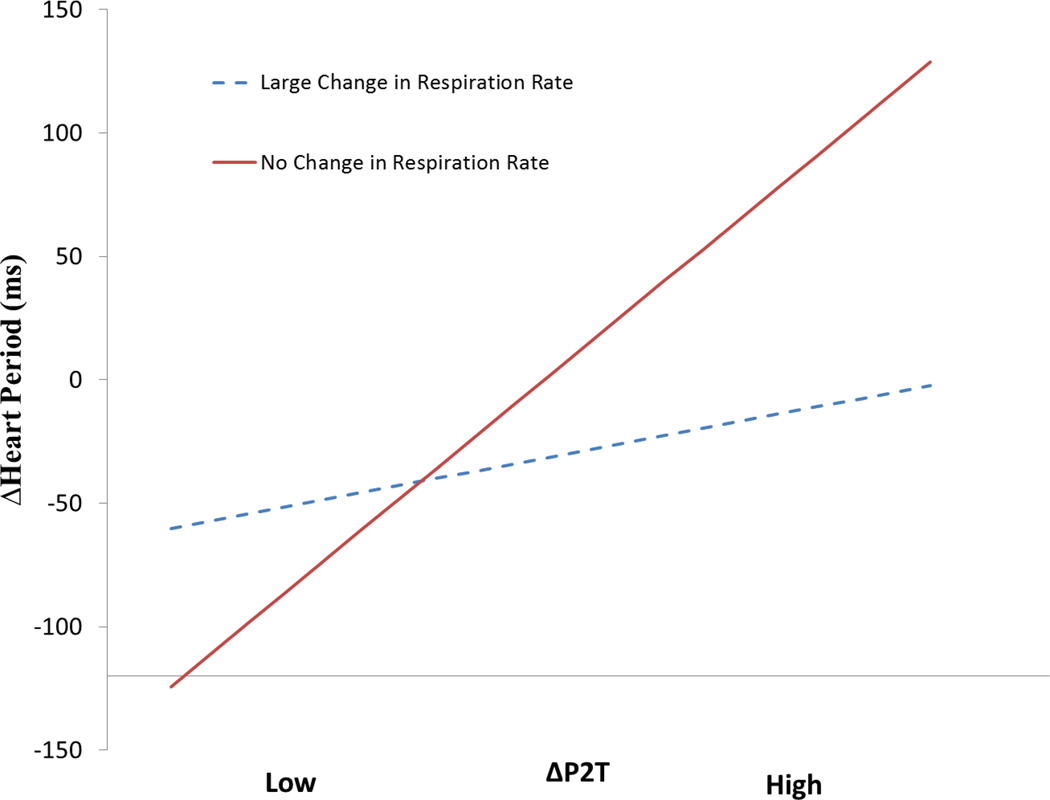
Figure 5.
Simple slopes of ΔP2T on ΔHeart Period at high and zero change in respiration rate following saline infusion. The high change group represents a sample drawn at +1 SD of the absolute change in respiration rate, 0.067 Hz. The zero change group is drawn at exactly 0 change. −1 SD is exactly 0.00085 Hz. Slopes calculated with software designed by Hayes and Matthes (2009). N = 24.

