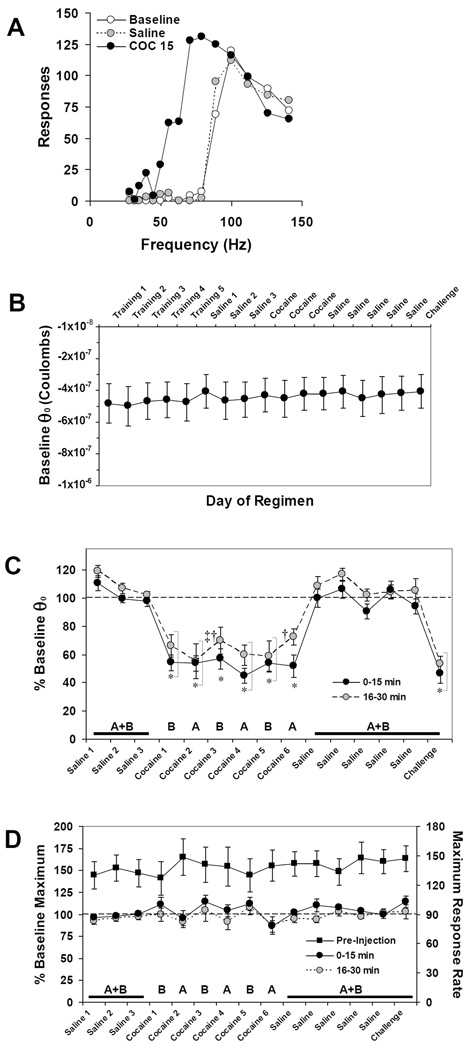
Figure 6.
BSR potentiation does not sensitize to cocaine. (A) Representative ICSS rate-frequency curves before (white circles) and after injection of saline (gray circles, dashed) or cocaine (15 mg/kg i.p., black circles). In this mouse, baseline pre-injection BSR threshold (θ0) was 77.9 Hz, was unchanged (78.8 Hz) after saline injection; and was lowered by cocaine (15 mg/kg i.p.) to 41.0 Hz, or 53% of baseline θ0. (B) Baseline pre-injection BSR threshold values expressed as mean charge delivery (in Coulombs) at θ0 ± SEM over the course of the experiment. (C) Changes from baseline θ0 after each injection expressed as the mean percentage of pre-injection θ0 ± SEM. Because the maximum effect of cocaine on BSR occurs within the first 15 minutes after injection, only the first two post-injection epochs (30 minutes total) are shown for clarity; see Results for details. (D) Pre-injection maximum number of responses (right ordinate) and changes in maximum operant response rates after each injection expressed as the mean percentage of pre-injection maximum response rates (left ordinate) ± SEM. In (C and D) letters indicate group tested on that day (see Figure 1). Black squares = pre-injection maximum operant response rate/minute (n = 17). Tukey’s: * = P < 0.05 vs. all saline days; ‡ = P < 0.05 vs. Saline 1–3; † = P < 0.05 vs. first day of cocaine withdrawal (Saline).

