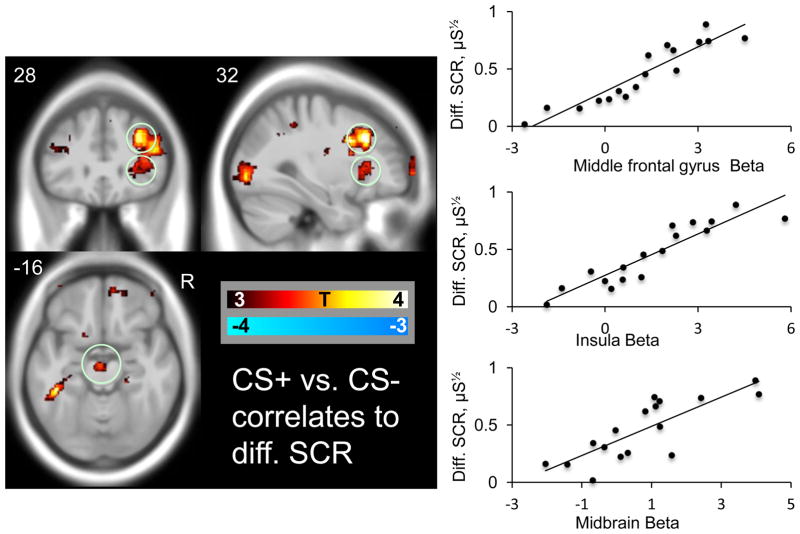
Figure 2. OLD correlates ofautonomic fear responses.
Correlations between conditioned BOLD and conditioned skin conductance responses in the whole brain analysis overlaid on an MNI template. The scatter plot indicates the correlation between BOLD beta estimates (CS+ vs. CS+) in the circled middle frontal gyrus, and in our a priori fear network regions: the insula and midbrain cluster and differential skin conductance responses (CS+ minus CS−).

