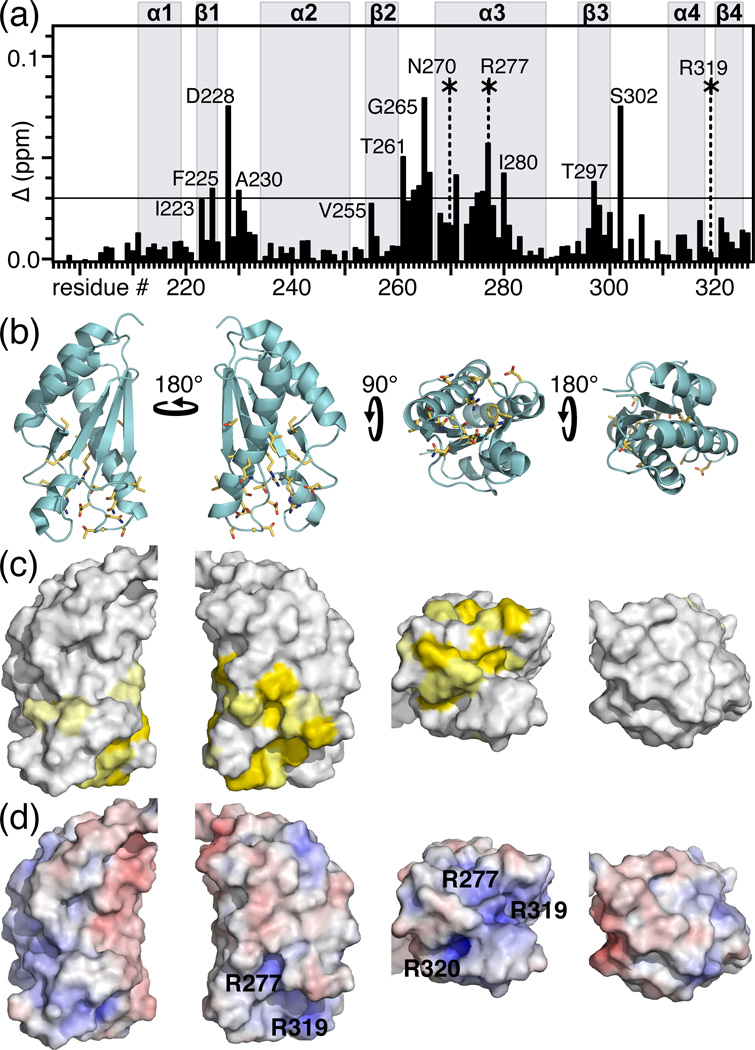
Figure 5. Peptidoglycan binding site of M. tuberculosis ArfA-c(D236A).
(a) Chemical shift changes in the spectrum of ArfA-c(D236A) induced by UMDP. The total chemical shift change (Δ) for each peak was calculated by adding the changes in 1H (ΔH) and 15N (ΔN) using the equation Δ = [(ΔH)2 + (ΔN/5)2]1/2. Asterisks indicate side chain NH peaks that undergo significant chemical shift or intensity changes. Values of Δ≥0.03 ppm (horizontal line) were mapped on the structure. (b, c) Molecular backbone and surface representations of ArfA-c(D236A) showing residues with Δ≥0.03 ppm (yellow) in the peptidoglycan binding site of ArfA. (d) Molecular surface representations colored by electrostatic potential, with isocontours shown at +8kBT (blue) and −8kBT (red), where kB is the Boltzmann constant, and T is the temperature.

