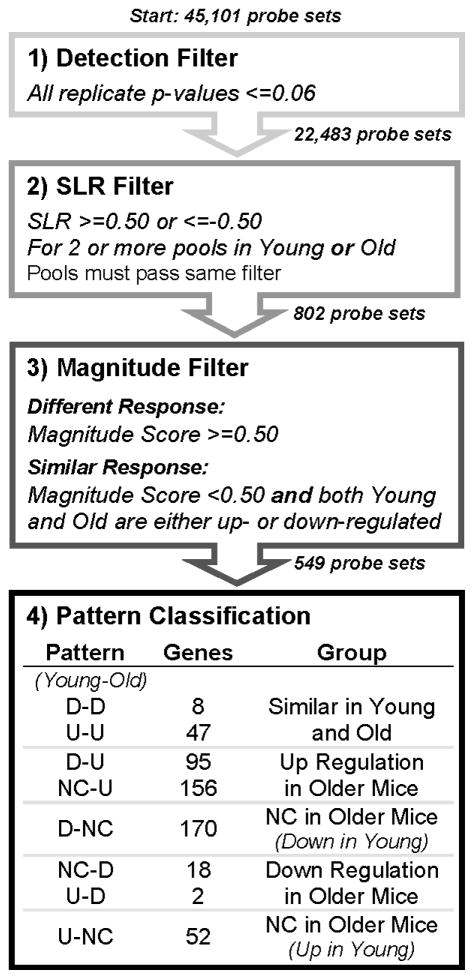
Figure 1.
Flowchart of filtering process. As described in the Methods, the 45,101 probe sets on the Affymetrix arrays were filtered, in a step-wise process, to identify genes that responded similarly or differently to DMM treatment between younger and older mice. Step 1 identified all genes with a signal that was significantly detected on the chip over the background. Step 2 identified significantly expressed or repressed genes in DMM joints, with respect to sham, in 2 or more replicate pools. Step 3 identified genes that either responded in a similar fashion between young and older mice, or had a significantly different response. These genes were then assigned to an expression pattern in Step 4for further analysis.

