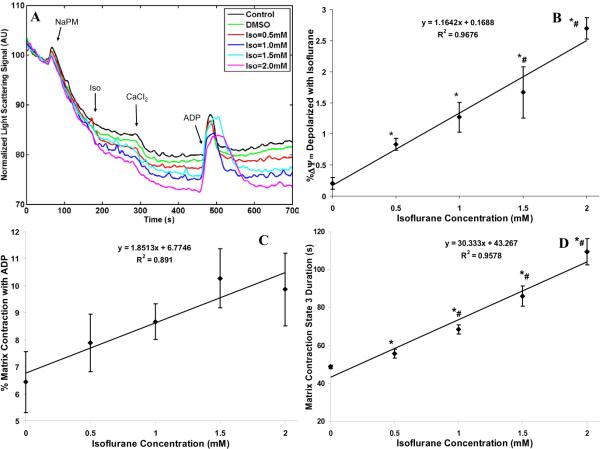
Figure 6.
(A) Time-course of matrix volume changes during states 2, 3 and 4 respiration with isoflurane (0.5, 1, 1.5 and 2 mM) compared to control (no treatment) and vehicle (DMSO) groups. A decrease in light scattering photon counts signifies volume expansion, while an increase signifies volume contraction. Light scattering signals were normalized with respect to their baseline levels. Traces represent means of 4 replicates in each group. Note that adding 0.5 mM CaCl2 (≈200 nM free Ca2+) had only a slight effect to further promote volume expansion after isoflurane. (B,C,D) Summary of effects of added CaCl2 on state 2 volume expansion in the presence of isoflurane, of isoflurane+ADP on state 3 volume contraction, and of isoflurane on state 3 -induced volume contraction; Isoflurane (0.5, 1, 1.5 and 2 mM) effect is compared to the DMSO (Iso = 0 mM) effect. Note that isoflurane caused further slight volume expansion in state 2 after adding CaCl2 (B), isoflurane stepwise reduced the state 3 -induced volume contraction (C), and isoflurane stepwise increased the state 3 -induced duration of matrix contraction (D). Data are plotted as means ±SE of 4 replicates. * indicates significant differences exist between isoflurane and control/DMSO groups, while # indicates significant differences exist between high and low isoflurane groups (p < 0.05).

