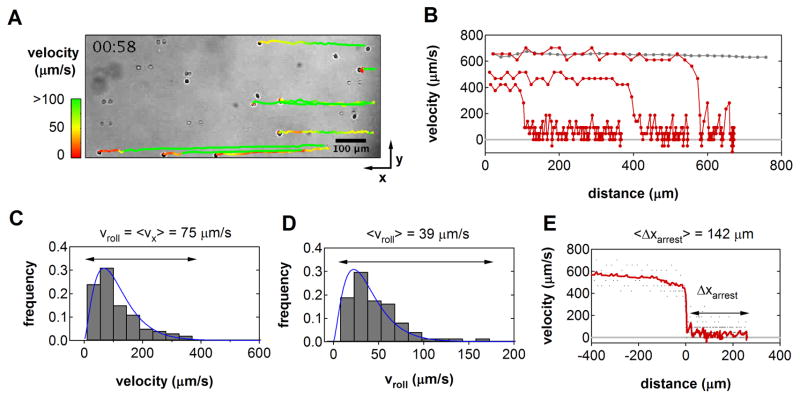
Figure 1.
In vitro Dynamics of T Lymphocyte Recruitment (A) Video micrograph of Jurkat T cells interacting with immobilized CXCL12/ICAM-1 in shear flow. Cells were perfused into parallel plate flow chambers at a shear rate of 100 s−1 (right to left). Trajectories for eight individual cells that ultimately arrested were reconstructed from video analysis. (B) Three characteristic velocity-distance profiles for cells that tethered, rolled, and arrested within the frame of view (red). The trajectory of a non-adherent cell is shown for comparison (gray). (C) Instantaneous velocity distribution for one individual cell prior to arrest. The macroscopic rolling velocity, vroll, is given by the mean of the distribution. (D) Population-level distribution of mean rolling velocities indicated significant heterogeneity among cells. In both (C) and (D), velocities varied according a gamma distribution (blue line), consistent with theory [18]. (E) Velocity-distance profiles from all cell trajectories were synchronized to the moment of tether formation to identify the range of arrest distances. The population average velocity as a function of distance is indicated (red).

