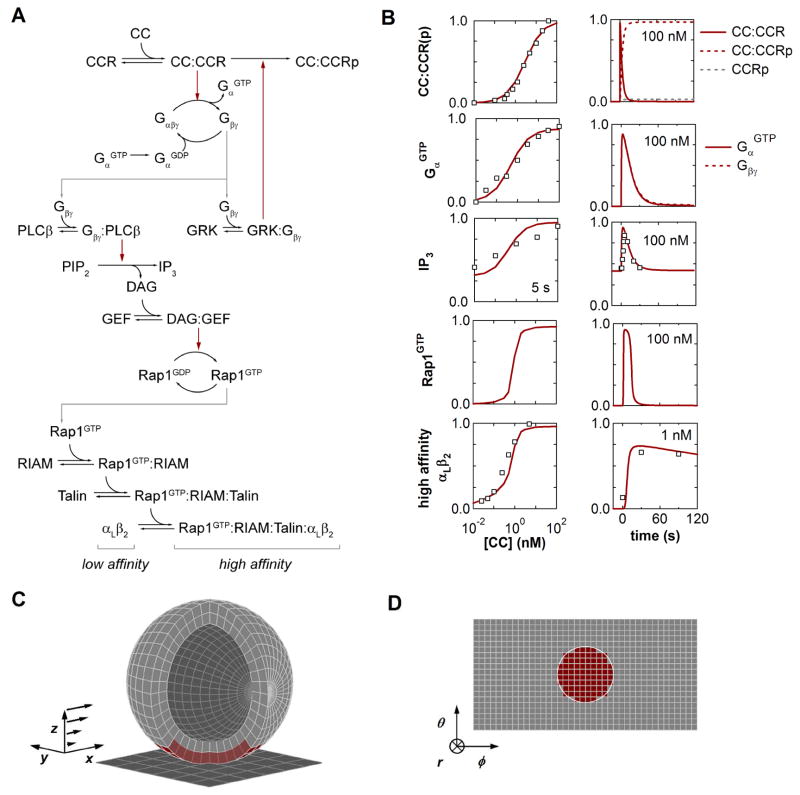
Figure 2.
Kinetic Model for Chemokine-Triggered Inside-Out Integrin Activation. (A) Inside-out reaction network linking chemokine recognition to integrin activation. Arrows indicate molecular association/dissociation (black) or catalytic phosphorylation/nucleotide transfer (red). (B) Experimental and simulated inside-out dynamics. The kinetic model (lines) was trained against a collection of experimental data (symbols) describing inside-out activation of αLβ2 integrins in human neutrophils responding to soluble CXCL8. (C) Model geometry for simulating T lymphocyte adhesion under flow. Membrane and cytosolic compartments were discretized into subvolumes based on a spherical lattice. (D). Projected cell surface from the reference frame of the cell. In (C) and (D), the extent of the cell-substrate contact zone is indicated by the subvolumes highlighted in red.

