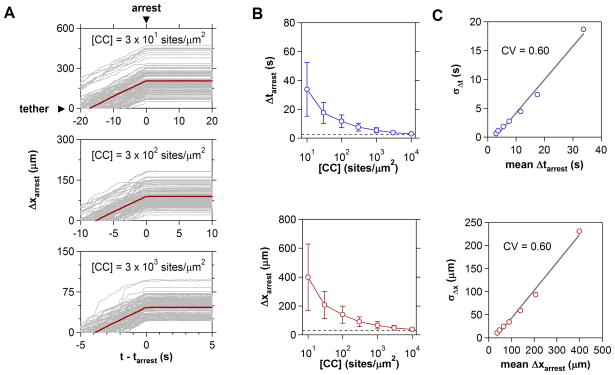
Figure 4.
Chemokine Regulation of T Cell Arrest. (A) Effect of increasing chemokine substrate concentration on time (Δtarrest) and distance (Δxarrest) to cell arrest. 500 trajectories synchronized to the moment of arrest and distance of tether formation are shown. The population mean is indicated in red. (B) Cell arrest metrics over four decades of chemokine concentration. Dashed lines indicate the minimum time and distance required to integrate inside-out stimuli. (C) Standard deviations of Δtarrest and Δxarrest distributions increase linearly with population mean. For both metrics, the coefficient of variation (CV) equals 0.60.

