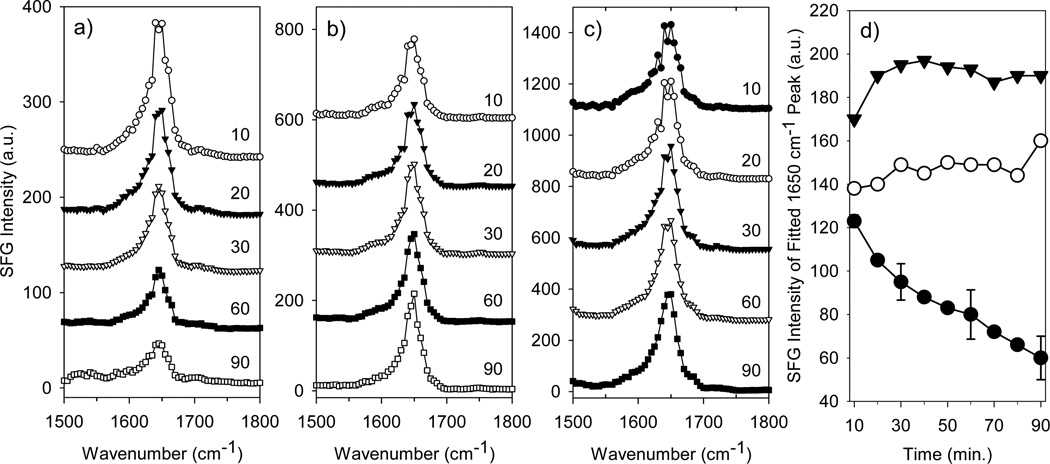
Figure 4.
SFG spectra of fibrinogen adsorbed to (a) a polyurethane, (b) a polyurethane-silicone copolymer and (c) a fluorinated polymer in PBS buffer in the amide I range collected at different times (in minutes). Alpha-helix SFG signal as a function of time (d) from fitting SFG spectra for fibrinogen adsorbed to the polyurethane (open circles), the polyurethane-silicone copolymer (closed circles) and the fluorinated polymer (closed triangles). Representative error is shown for the fibrinogen/polyurethane sample (Reproduced with permission from J. Phys. Chem. B 2005, 109, 22027–22035. Copyright 2005, Am. Chem. Soc.).

