
Figure 4.
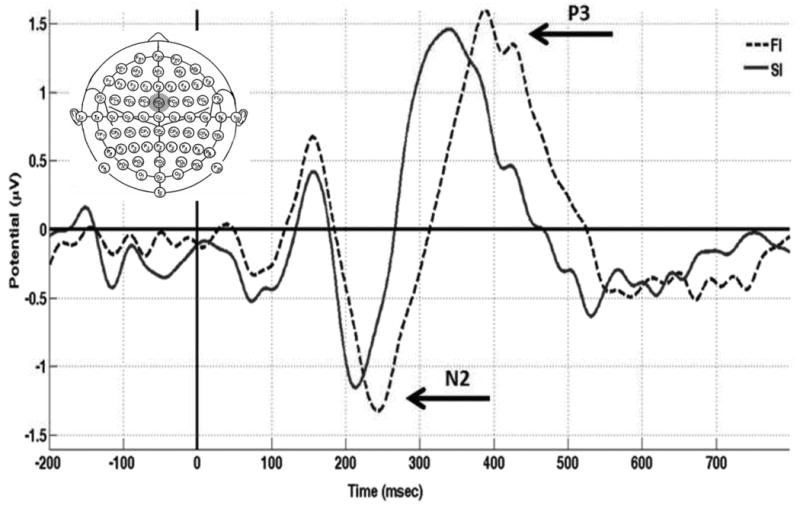
ERPs time-locked to STOP signal for successful inhibition (SI; bold line) and failed inhibition (FI; dotted line) stop trials averaged across all participants at the electrode of interest where the effect was greatest across all conditions, electrode FCz (grey circle). There was a significant difference between conditions for the latency, but not for amplitude, for each component (N2/P3).