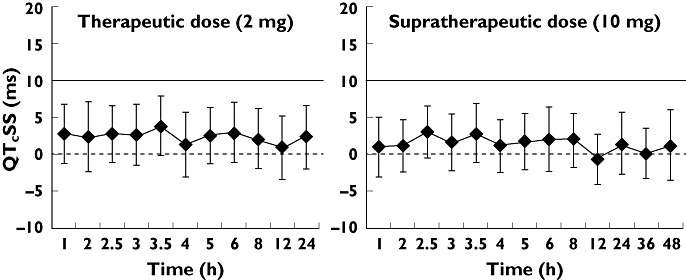
Figure 1.

Mean QTcSS differences (ms) in time-matched change from baseline between A) prucalopride (2 mg) and placebo, and B) prucalopride (10 mg) and placebo, by time point. Error bars represent 90% CIs. The solid line indicates the usual 10 ms regulatory threshold
