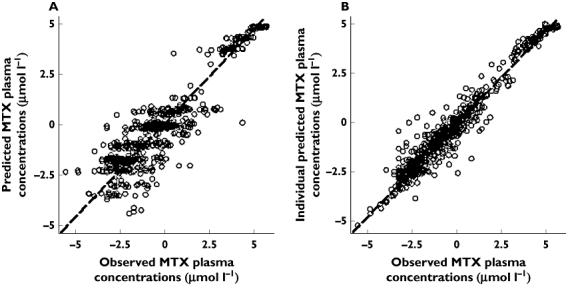
Figure 1.

Goodness-of-fit plots of the final population pharmacokinetic model (all data log-transformed, drug concentration as µmol l−1). Observed MTX concentrations vs. model predictions (A) and vs. individual Bayesian predictions (B)

Goodness-of-fit plots of the final population pharmacokinetic model (all data log-transformed, drug concentration as µmol l−1). Observed MTX concentrations vs. model predictions (A) and vs. individual Bayesian predictions (B)