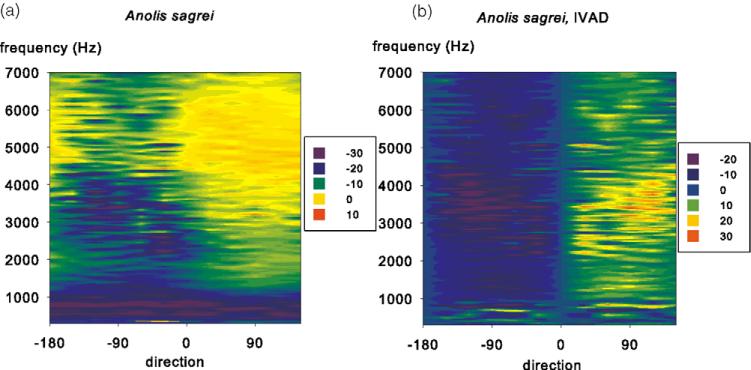
Fig. 1.
Eardrum directionality in the lizard species Anolis sagrei. (A) The normalized vibration velocities (colour scale, in dB re 1 mm/(s Pa)) are plotted as a function of direction (x-axis, contralateral angles on the left and ipsilateral angles on the right) and frequency (y-axis). Each horizontal line corresponds to a polar plot. (B) Interaural difference plot modelling the output of a binaural difference (EI) neuron in Anolis sagrei. The eardrum vibration data set is subtracted from its reflection along the body axis. The colour scale is relative interaural differences in dB. From Christensen-Dalsgaard and Manley [10,11].

