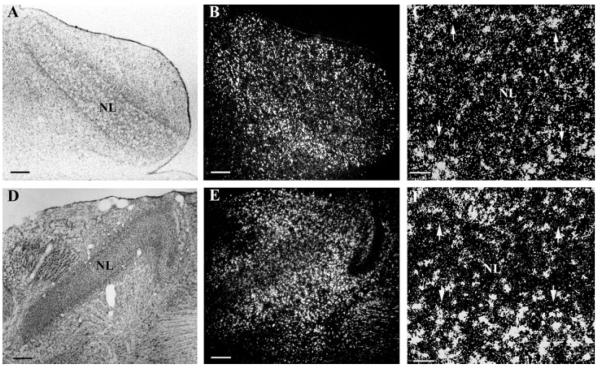
Figure 5.
Numbers of oligodendrocytes in NL increase in the second week posthatch. In situ hybridization using anti-sense PLP riboprobes in both high frequency coding NL (A–C) and low frequency NL (D–F) at P12 showed that numbers of oligodendrocytes at the NL border decreased and numbers of oligodendrocytes in NL increased. Also, oligodendrocytes outside NL have higher PLP mRNA levels than oligodendrocytes within NL. (A/B) and (D/E) are same images taken under bright field microscopy (A, D) and dark field microscopy (B, E), respectively. (C, F) are higher magnifications of (B, E). Arrows mark the NL border. Scale bar: (A, B, D, E) 250 μm, (C, F) 50 μm.

