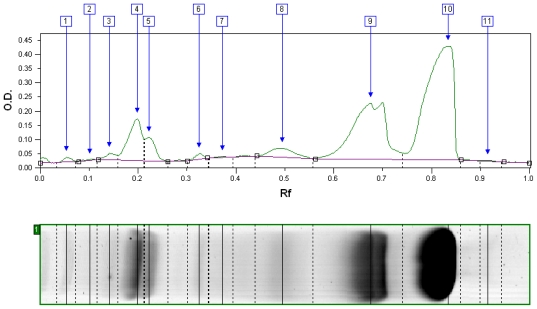
Figure 2.
Typical sodium-dodecyl-sulfate polyacrylamide gel electrophoresis (SDS-PAGE) profile of the aggregate fraction as analyzed with densitometry. Color-density peaks are ordered by decreasing molecular weight of proteins: Peaks #1 to 6, lactoferrin, bovine serum albumin and immunoglobulins; #7, 8, 11, casein and casein fragments; #9, β-lactoglobulin (β-LG); #10, α-lactalbumin (α-LA).

