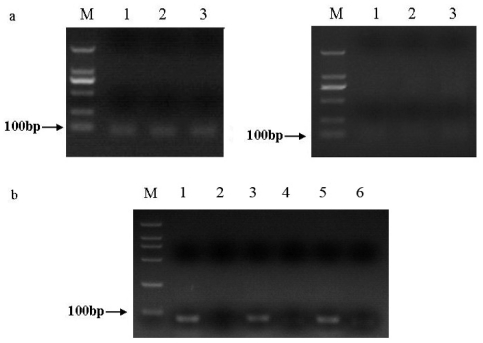
Figure 1.
(a) Performance of Groups 1 primers by stem-loop RT-PCR. The bands size is amplified as shown by the arrow along with a 100 bp DNA marker (M). Left are PCR products of putative miR-2a (1), bantam (2), and miR-14 (3) of S. litura which were 89 bp, 89 bp, 86 bp, respectively, and their corresponding minus-RT control are shown on the right; (b) Performance of Groups 2 primers by stem-loop RT-PCR. The bands size is amplified as shown by the arrow along with a 100 bp DNA marker (M). PCR products of putative miR-2a (1), bantam (3), and miR-14 (5) of S. litura were 79 bp, 79 bp, 76 bp, respectively, and minus-RT control by using primers of miR-2a (2), bantam (4), and miR-14 (6) were shown besides the putative miRNAs.

