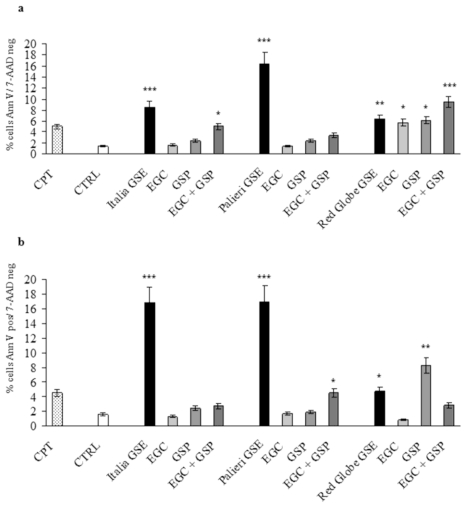
Figure 5.
EGC and GSP induced apoptosis versus GSE. (a) Effects of commercially available EGC and GSP at the concentration they have in 100 μg/mL of GSE obtained from Italia, Palieri and Red Globe cultivars on apoptosis of Caco2 and (b) HCT-8 cells after 24 hours versus 100 μg/ml of GSE. Results are the mean ± SD of three independent experiments performed in duplicate. * p < 0.05; ** p < 0.01; *** p < 0.001 versus CTRL.

