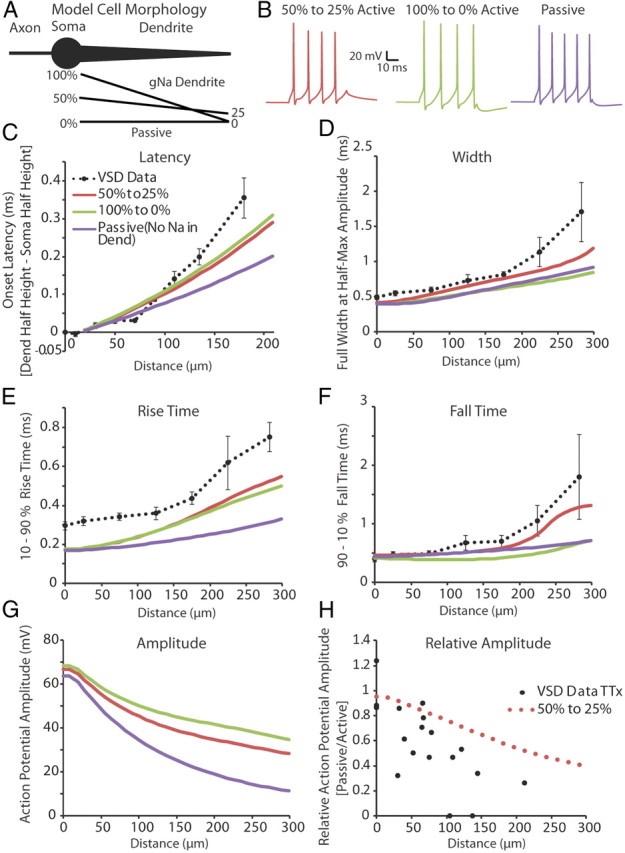
Figure 10.

A gradient of voltage-gated sodium and potassium channels along the dendrite can explain much of the broadening and slowing velocity of an action potential as it propagates away from the soma. A, Illustration of the model cell morphology. The simplified three-component morphology included an axon, cell body, and a single tapering dendrite. Black lines below the dendrite correspond to gradients in the sodium conductance along the dendrite as a percentage of that found in the soma (see Materials and Methods, Computer simulation). The potassium conductance followed the same linear percentage gradient as the sodium distribution for each condition, except during Passive where it was set to 50–25% of the somatic potassium conductance. B, Example of spiking behavior recorded at the soma in response to a 50 ms, 200 pA step depolarization at the model soma under each of the different dendritic conditions. C–F, Onset latency, full-width at half-height, 10–90% rise time, and 90–10% fall time of the first action potential in a train (elicited by a somatic step depolarization; 50 ms, 200 pA stimulation) recorded along the length of the dendrite. Dashed black lines correspond to experimental data collected using voltage-sensitive dyes. Experimental data were binned in 50 and 66 μm (Width, Rise Time, Fall Time) or 20, 30, and 60 μm (Soma to Dendrite Latency) segments (average ± SEM). G, Predicted action potential amplitude as a function of distance along the dendrite. H, In support of the model, the predicted ratio of action potential amplitude before and after TTX application versus distance along the dendrite is approximately correct.
