Figure 4.
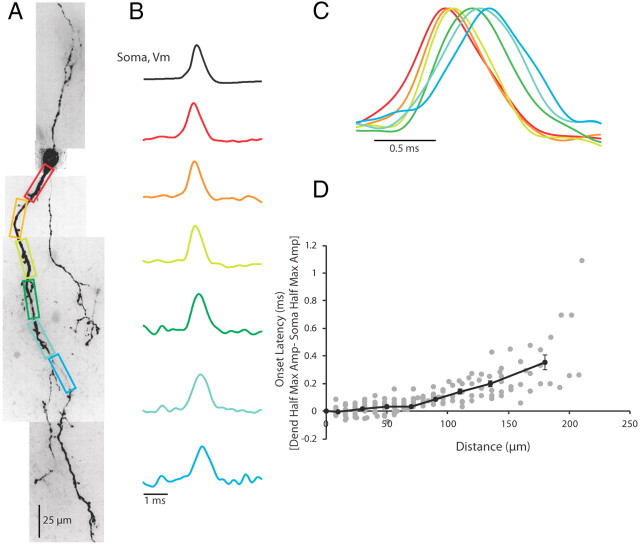
Action potentials occur first in the soma/proximal dendrite in response to a somatic step depolarization. A, Confocal z-projection of a voltage-sensitive dye-filled interneuron. Colored boxes correspond to dendritic regions of interest. B, Electrical and optical signals corresponding to the first action potential in a train. Electrical and optical signals are an average of three trials. Black trace is the somatic electrode recording. Colored traces are optical signals (ΔF/F) recorded at 10 kHz along the dendrite. Colored traces refer to colored regions of interest in A. Optical and electrical traces are normalized to peaks. C, Overlay of optical traces in B illustrating the timing of action potential occurrence in the dendrite. D, Scatter plot of the onset latency of the action potential in the dendrite as a function of distance (gray dots). Onset latency was defined as the difference between the time of half-maximum amplitude of the action potential at the dendrite and the soma. Black line shows average onset latencies for bins of 20 μm from 0 to 120 μm along the dendrite. From 120 to 150 μm, data averaged in 30 μm size bins. From 150 to 210 μm, data averaged in 60 μm size bins. Error bars indicate ±SEM. N = 14 cells in D. All data in plots are optical.

