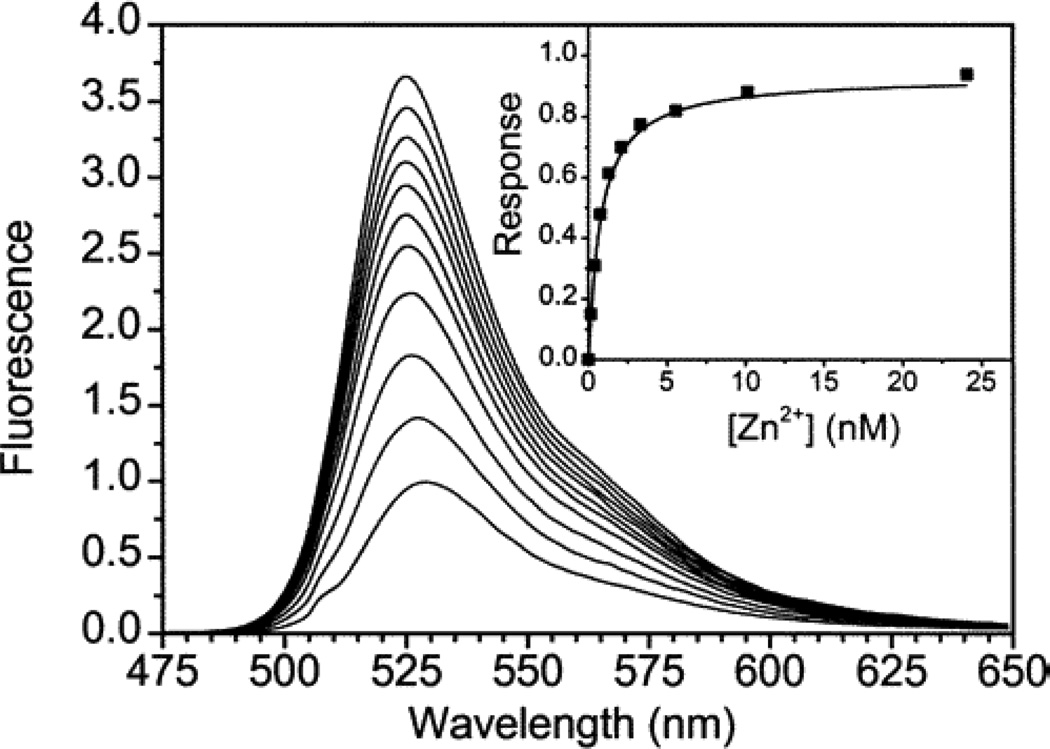
Figure 1.
Fluorescence spectra of 0.5 µM ZP1 with incrementally higher concentrations of zinc. Spectra were acquired in pH 7.0 buffer (50 mM PIPES, 100 mM KCl) at 25 °C; λex = 507 nm. The first 10 spectra correspond to free zinc concentration between 0 and 24 nM; the eleventh spectrum was obtained with ~25 µM free zinc. Inset: integrated emission (rectangles) was analyzed by least-squares fitting (solid line) to give a dissociation constant of 0.7 nM. Reprinted with permission from Walkup et al, 2000. Copyright 2000 American Chemical Society.

