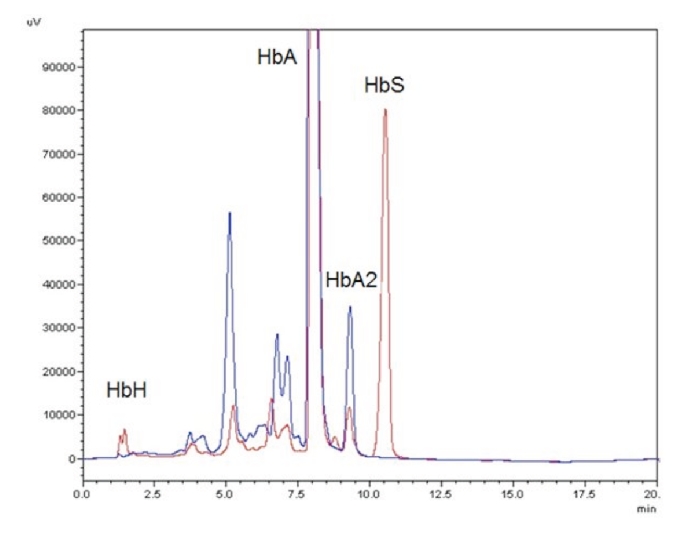
Figure 1.

High-performance liquid chromatography pattern of our patient with Hemoglobin H (HbH) disease. Red graph represents our patient with clear HbH/HbBart's peak at 1.5 minutes and a HbS peak at 11 minutes retention time. Blue graph is a control.
