
Fig. 1.
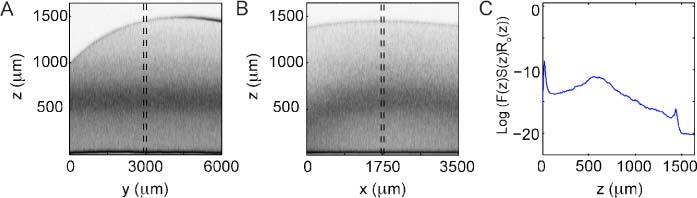
OCT cross-sectional images of a representative microsphere correction phantom highlighting the confocal and scanning modulations over the (A) (y-z) range; and (B) (x-z) range. (C) Correction profile generated from the correction phantom 3D-OCT data set over the region indicted by the dotted lines in A and B. The back interface of the phantom is visible as the curved surface in the cross-sectional images and as a sharp peak of lower-intensity in the correction profile.