
Fig. 2.
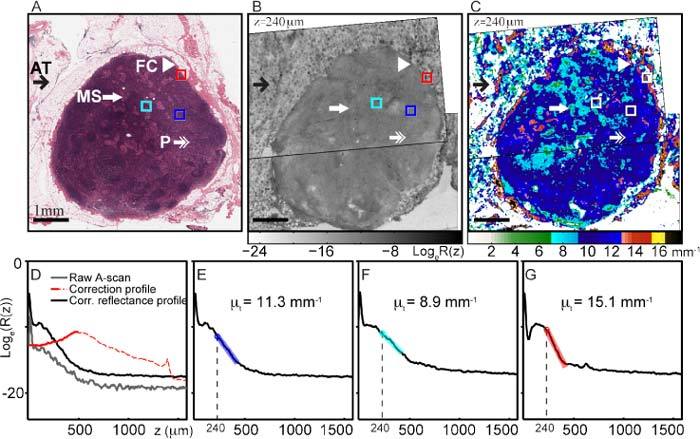
Measured attenuation coefficients for a section of healthy lymph node. (A) Co-registered H&E-stained histology identifying tissue regions: MS, medullary sinuses (thick white arrow); P, paracortex (white double-headed arrow); FC, fibrous capsule (white arrowhead); and AT, adipose tissue (black arrow). (B) En face (x-y) OCT image at a depth of 240 μm from the window/tissue interface. Colored boxes at this depth indicate regions over which attenuation coefficients were measured. (C) Parametric image of measured attenuation coefficients (mm−1) with a custom color map. Points with R2 < 0.7 for the fit are excluded and are shown in white. (D) An example of the correction profile (red) used to generate a corrected reflectance profile (black) from its raw A-scan (grey). The dashed region of the correction profile is not used in the correction as the reflectance profile is below the noise floor for this region. Resulting averaged reflectance profiles at the centre of the colored boxes given in A and B and their linear fittings with R2 > 0.98 are shown in: (E) paracortex (dark blue); (F) medullary sinuses (light blue); and (G) fibrous capsule (red). Signal peaks at z = 0 are due to specular reflection from the window/tissue interface. Scale bars = 1 mm.