
Fig. 4.
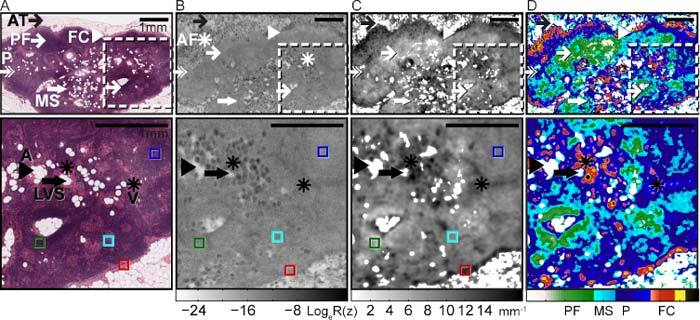
Healthy lymph node with prominent cortex and fatty hilum. (A) Co-registered H&E-stained histology identifying tissue regions and features of interest: PF, primary inactive cortical follicles (thin white arrow); P, paracortex (white double-headed arrow); MS, medullary sinuses (thick white arrow); AT, adipose tissue (thin black arrow); FC, fibrous capsule (white arrowhead); A, adipocytes (black arrowhead); LVS, lymphovascular spaces (thick black arrow); V, vessels (black asterisk). (B) En face (x-y) OCT image at a depth of 240 μm from the window/tissue interface. Superficial adipocytes cause AF, artifact (white asterisk) in the OCT image. (C) Gray-scale parametric image of measured attenuation coefficients (mm−1). (D) Parametric image presented with a custom color map. Lower panels 2.5 × magnified regions represented by white dashed boxes in the corresponding upper panels. Colored boxes indicate regions of distinct tissue type over which attenuation coefficients were measured: primary inactive cortical follicles (green); paracortex (dark blue); medullary sinus (light blue); fibrous capsule (red). Scale bars = 1 mm.