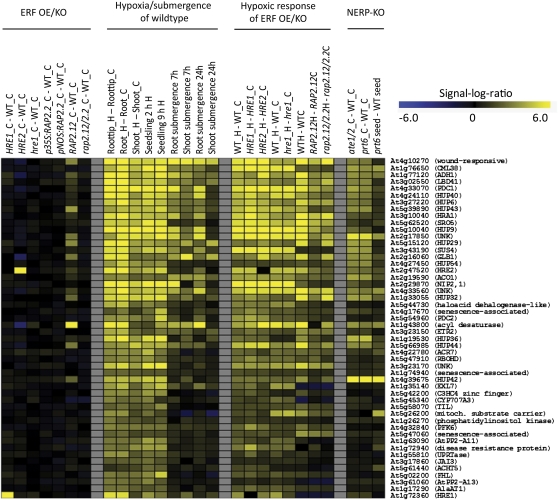
Figure 1.
Heatmap for Core Hypoxia Response Genes in Arabidopsis.
Expression data for the 49 core hypoxia response genes (Mustroph et al., 2009) and HRE1 (which is not included in the 49 core genes) under low-oxygen stress and in mutants for group VII ERF tfs or the N-end rule pathway. Data are signal-log ratios (stress versus control or mutant versus the wild type) of robust multiarray average–normalized expression data obtained from ATH1 microarray chips. Yellow color represents upregulation and blue color represents downregulation of the respective genes. Maximal color intensities refer to a signal-log ratio of ±6.0 (64-fold change). Data are from the following sources: HRE1, HRE2 overexpression (OE) (Licausi et al., 2010); hre1-RNA interference (RNAi) (Yang et al., 2011); RAP2.2 overexpression (Welsch et al., 2007); RAP2.12 overexpression and artificial micro RNA (amiRNA) (Licausi et al., 2011a); hypoxic response of root tips, roots, and shoots (Mustroph et al., 2009); hypoxic response of seedlings (Branco-Price et al., 2008); submergence response of roots and shoots (Lee et al., 2011); hypoxic response of HRE1 and HRE2 overexpressors (Licausi et al., 2010); hypoxic response of hre1-RNAi (Yang et al., 2011); hypoxic response of RAP2.12 overexpression and amiRNA (Licausi et al., 2011a); and knockouts (KOs) of N-end rule pathway genes PRT6 and ATE1/ATE2 (Gibbs et al., 2011). Abbreviations of gene names were taken from Mustroph et al. (2010). HUP, hypoxia-induced unknown protein; UNK, unknown protein not included in the list of HUP genes.

