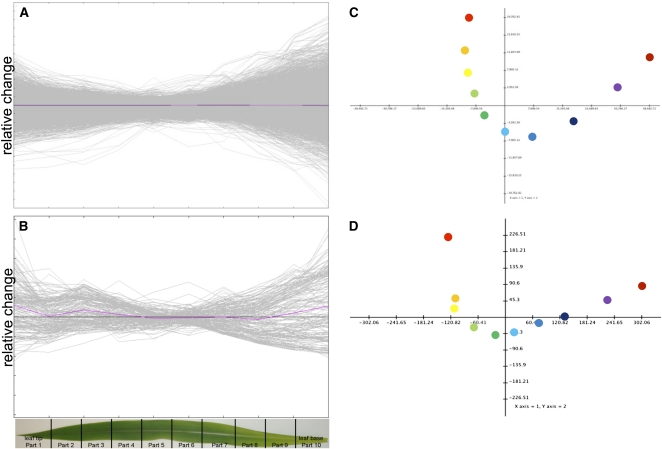
Figure 1.
Relative Transcript and Metabolite Levels Are Organized along the Developmental Gradient of the Leaf.
Relative transcript abundance (A), relative metabolite abundance (B), and principal component analysis (C) of transcript levels. The first two components explain 83.5% of the variation (D) principal component of the metabolite levels. The first two components explain 85.5% of the variation.

