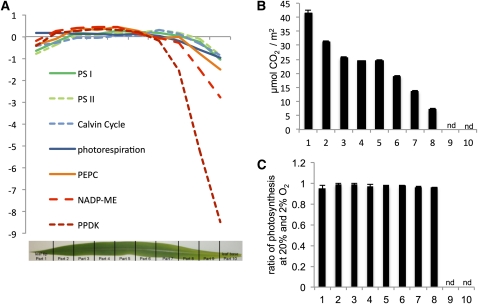
Figure 2.
Photosynthetic Transitions in the Maize Leaf.
(A) Average relative expression levels for the transcripts encoding photosystem I, photosystem II, the RPPP and three key C4 proteins.
(B) Photosynthetic rate along the light-exposed leaf. Error bars depict sd of three biological replicates. nd, not determined since not exposed to light.
(C) Ratio of photosynthesis at 20% and 2% O2 concentration along the leaf gradient. Error bars depict sd; nd, not determined since not exposed to light, two technical replicates.

