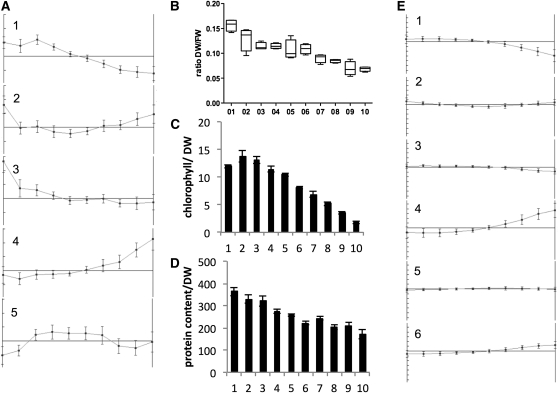
Figure 3.
Changes along the Leaf Gradient.
(A) K-means clusters of metabolites. Cluster 1 is the pyruvate cluster with 23 members; cluster 2 contains 15 metabolites; cluster 3 is the raffinose cluster with 10 members; cluster 4 is the building block with 60 members; cluster 5 is the malate cluster with 10 members.
(B) The fresh weight (FW)–to–DW ratio indicating a low water content at the leaf tip.
(C) The chlorophyll content.
(D) and (E) The protein content (D) and K-means clustering of transcripts (E). Error bars indicate sd of four biological replicates.

