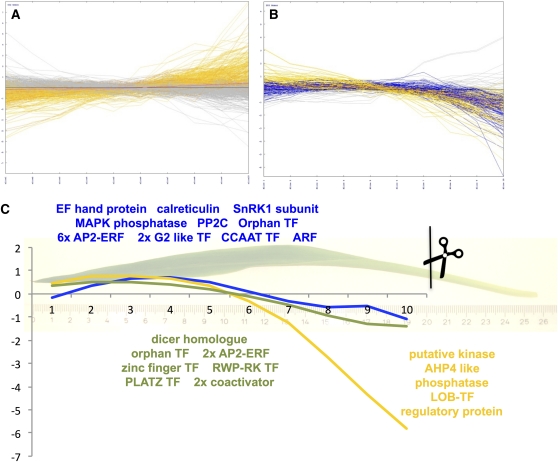
Figure 4.
Targeted Expression Analysis of Regulatory Functions.
(A) and (B) Expression pattern of transcripts detected as low at the tip (A) and high at the tip (B) in a previous analysis. Patterns in orange confirm the expectation based on Li et al. (2010), patterns in blue partially confirm, and patterns in gray have different patterns.
(C) Transcripts coexpressed with PEPC (blue), NADP-ME (green), and PPDK (yellow) major isoforms.

