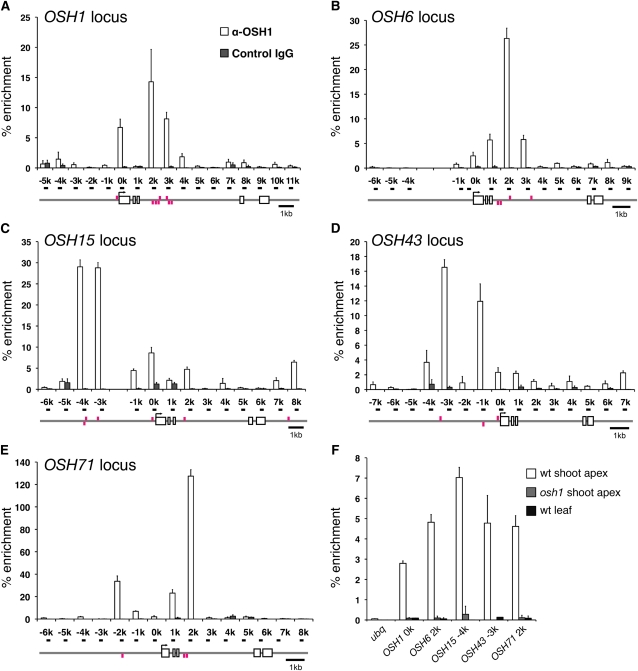
Figure 5.
OSH1 Protein Binds to Five KNOX Loci in Vivo.
ChIP assay using anti-OSH1 antibody followed by qPCR analysis of the OSH1 (A), OSH6 (B), OSH15 (C), OSH43 (D), and OSH71 (E) locus. Gene structures are indicated below the graphs. Primers used in qPCR were named after their position relative to the transcription start site of each gene and are shown as black bars on the gene structures. Magenta bars above and below the gene structure represent conserved TGAC sequences in the plus and minus strands, respectively. The percentage of enrichment represents the amount of immunoprecipitated DNA relative to input DNA. Each data point is the average of three independent biological replicates. Error bars represent the sd.
(A) to (E) ChIP assay from 5-mm young panicles of the wild type. For a negative control, control rabbit IgG was used.
(F) ChIP assay from vegetative tissues. For a negative control, osh1 shoot apex and wild-type (wt) young leaf primordia were used.

