Figure 3.
Knockdown of LTO1 Results in a Growth Defect.
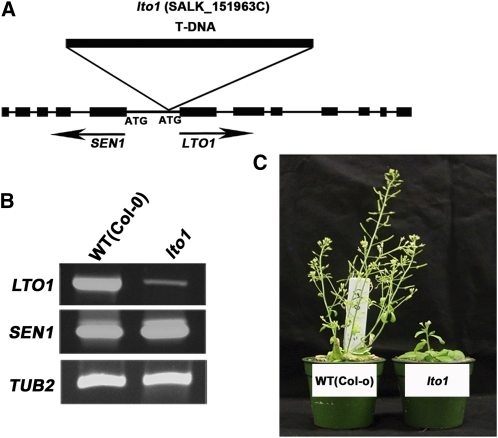
(A) Structure of LTO1 and SEN1. Black boxes represent exons and thin lines correspond to introns in SEN1 and LTO1. The initiation codons (ATG) of SEN1 and LTO1 are indicated. The position of the T-DNA insertion in the SALK_15193C line is indicated.
(B) Expression of LTO1. Transcripts corresponding to LTO1 and SEN1 were analyzed by RT-PCR in homozygous lto1 and wild-type (WT [Col-0]) plants. TUB2 was used as a control for constitutive expression. To ensure that amplification was in the linear range, the optimal number of cycles was determined for each couple of primers separately. PCR amplification products were separated by electrophoresis in agarose gel and ethidium bromide stained. The gel was imaged using an imaging system. Four independent biological replicates were performed for this experiment, and one representative is shown in the figure.
(C) The lto1 mutant displays a growth defect. Wild-type (Col-0) and lto1 homozygous plants are shown 6 weeks after seed germination on soil.
[See online article for color version of this figure.]

