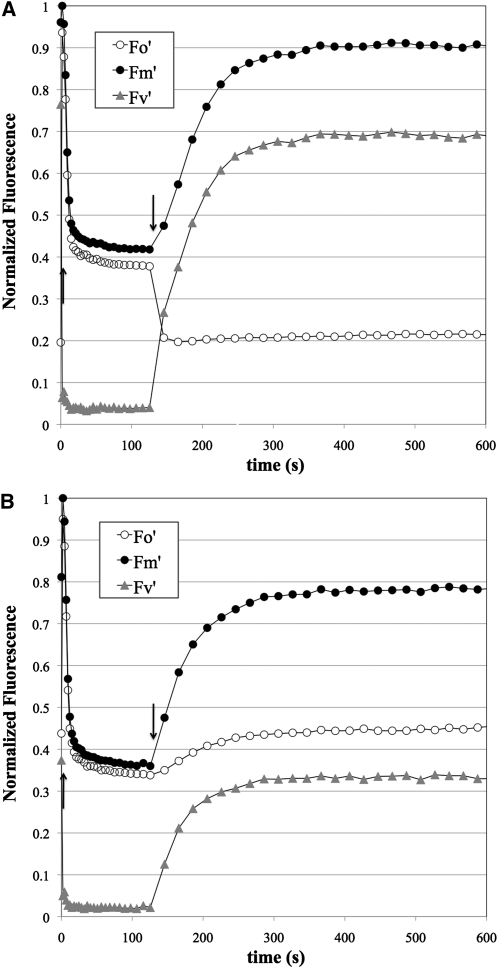
Figure 4.
The Photosynthetic Defect in the lto1 Mutant Is Due to a Limitation in the Electron Flow from PSII.
Fluorescence induction of representative leaves from wild-type (A) and lto1 (B) plants. Fluorescence was measured using a 10-μs pulse of 430-nm light and appropriate filters to transmit red light. Actinic illumination provided by 520-nm LEDs (1.4 mmol photons m−2 s−1) commenced immediately after taking F0 and FM values at time 0. At each time point, fluorescence immediately before (F0, open circles) and after (FM, closed circles) a 80-ms saturating pulse was measured during a brief window in which the actinic light was off (see Methods for details). After 2 min, the actinic light was extinguished and the recovery of fluorescence was followed in the same manner. The variable fluorescence at each point (FV = FM − F0) is also shown as gray triangles. All fluorescence values were normalized to FM; thus, what is shown is actually FM/FM (closed circles), F0/FM (open circles), and FV/FM (gray triangles). Upward and downward arrows indicate when the actinic light was on or off, respectively.

