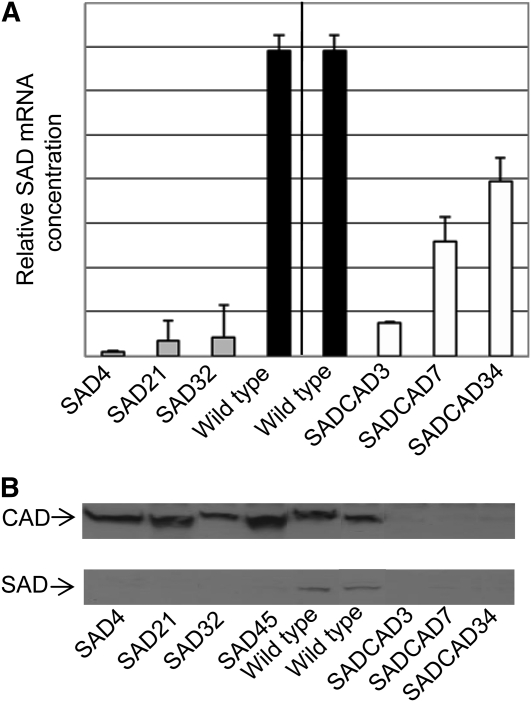
Figure 4.
SAD and CAD Expression in SAD and SAD CAD Lines.
(A) Relative SAD mRNA concentration in stems of the wild-type, SAD, and SAD CAD plants evaluated by real time RT-PCR. Means and sd for three separate experiments on independent plants of three SAD and three SAD CAD lines were calculated using the standard curve method (User Bulletin no. 2, ABI PRISM 7700 Sequence Detection System software).
(B) Immunoblots of stem extracts from the wild-type, SAD, and SAD CAD lines probed with antiserum raised against tobacco CAD (Top) or aspen SAD (Bottom).

