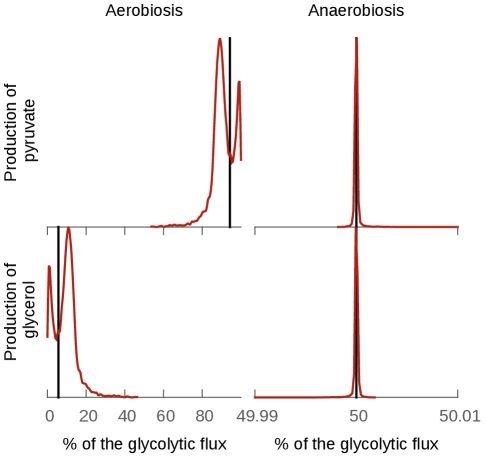
Figure 4. Effect of the uncertainties on the distribution of the glycolytic flux between the production of pyruvate and glycerol.
The glycolytic flux is defined as the sum of the fluxes producing glycerol and pyruvate. The black lines represents the percentage of the glycolytic flux in the pyruvate branch (top) and the glycerol branch (bottom) in the fixed parameter model. The red line is the distribution of the percentage of the glycolytic flux in the collection of models generated from the parameter probability distributions. The division of the flux between the pyruvate branch and the glycerol branch is well conserved. The effect of the uncertainties of the parameters is almost non-existent in anaerobic conditions (simulated by setting the glycerol 3-phosphate oxidase  parameter to 0). In aerobic conditions the effect is more important, indicating that this division is not entirely due to the topology of the model in this case.

