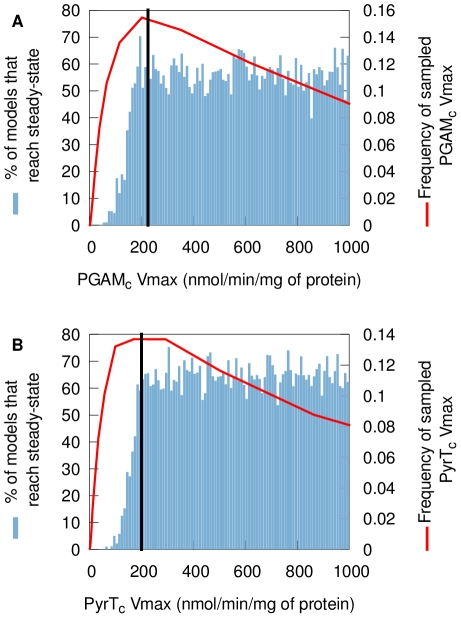
Figure 6. Percentage of sampled models that reach steady-state within 300 minutes as a function of the  of pyruvate transport and phosphoglycerate mutase.
(A) Percentage of models that reach steady-state within 300 minutes as a function of phosphoglycerate mutase  (B) Percentage of models that reach steady-state within 300 minutes as a function of pyruvate transport
  . The red line is the distribution of the parameter as it is usually sampled. The black line is the fixed-parameter value. A model which has a value for one of these two parameters smaller than the mean will easily fail to reach steady-state, whatever the other parameter values and despite these
  values still being close to their mean. This reveals fragilities in the model.

