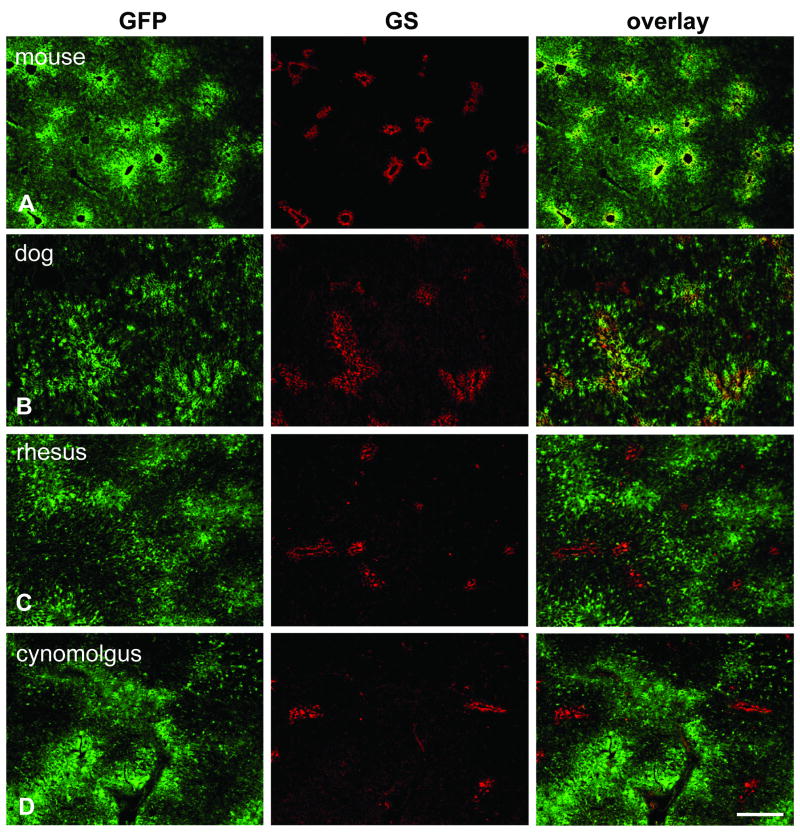
Fig. 1.
Immunofluorescence staining on liver after gene transfer with AAV8 expressing GFP from the TBG promoter. Sections were stained with antibodies against GFP (green, left column) and glutamine synthetase (GS) as marker for central veins (red, middle column). The overlay of both stains is shown in the right column. All animals were analyzed seven days after vector treatment and received a dose of 3×10¹² GC/kg except for the mouse (1×10¹¹ GC per animal) and the dog (1.82×10¹³ GC/kg). A. Mouse liver (group 2). B. Dog liver (animal S473). C. Juvenile rhesus macaque (animal RQ8082). D. Adult cynomolgus macaque (animal C13992). Scale bar: 400 μm.

