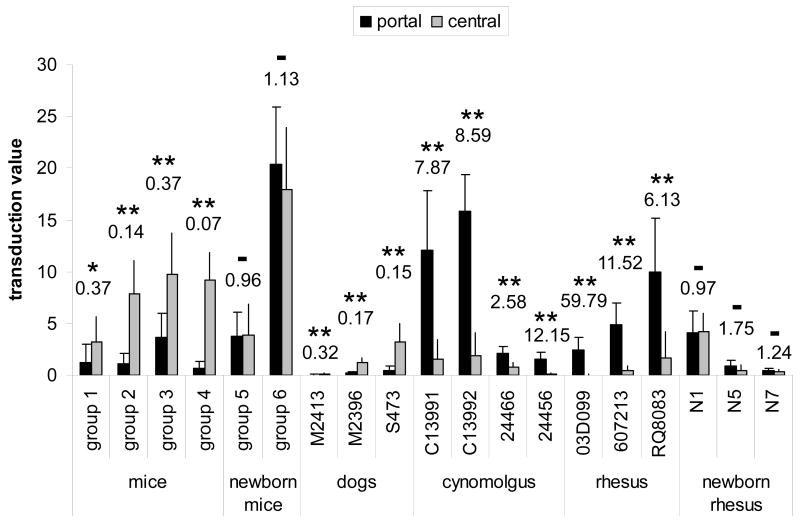
Fig. 3.
Morphometric analysis comparing portal and central transduction levels in mice, dogs, and non-human primates after treatment with vector as adults or newborns. Portal-central ratios of the transduction values are shown above each group or animal. Statistical significance between portal and central transduction values as determined by student t-test is indicated by asterisks (* p = 0.012, ** p < 0.001), no significance by – (p > 0.1). See Table 1 for type of vector, dose, time point and other details. All animals received AAV8 expressing GFP from the TBG promoter with the exception of mice from group 1 (scAAV8 expressing hOTC detected by immunofluorescence staining) and cynomolgus macaques 24466 and 24456 (scAAV7 expressing GFP from CB promoter). Self-complementary vectors have been used in mice groups 1 and 4 and for macaques 24466 and 24456. The transduction value was determined by measuring the average transduced area within a 225 μm radius around either central or portal veins and is reported as percentage per total image area (see Materials and Methods for details).
Error bars represent standard deviation.

