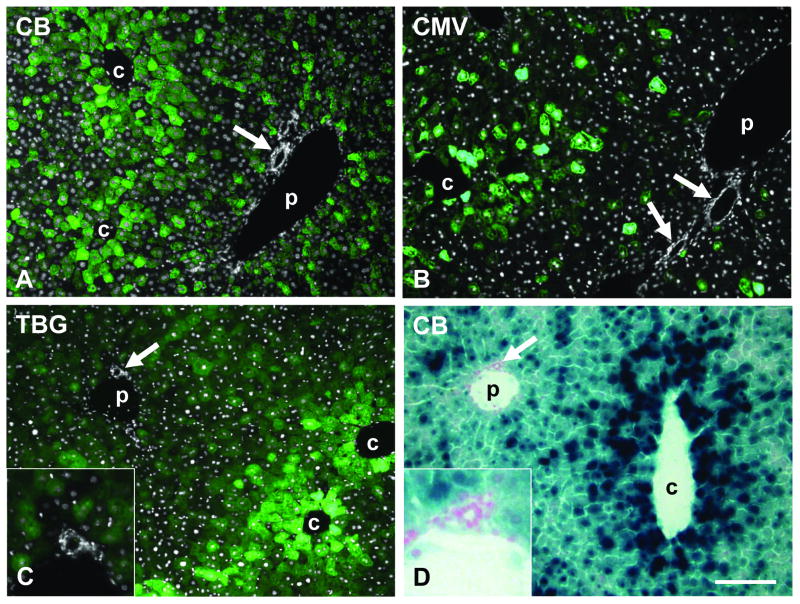
Fig. 4.
Predominantly pericentral transduction in mouse liver after tail vein injection of AAV8 vectors with different promoters and transgenes at a dose of 1×10¹¹ GC per animal. A – C shows GFP fluorescence (green) overlaid with DAPI staining (white) to demonstrate bile duct and hepatic artery, D shows X-gal staining for β-galactosidase expression. A. GFP expressed from CB promoter (day 14 post injection). B. GFP expressed from CMV promoter (day 9). C. GFP expressed from TBG promoter (day 7). D. nLacZ expressed from CB promoter (day 14). Arrow marks bile duct or hepatic artery (shown enlarged in insets). c and p indicate central and portal vein, respectively. Scale bar: 150 μm.

