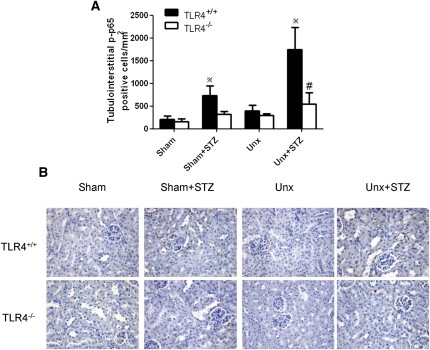
Figure 12.
Renal cortical phosphorylated NF-κB/p65 nuclear staining in diabetic and nondiabetic TLR4−/− and wild-type mice with or without Unx. (A) Quantitative analysis of phosphorylated NF-κB/p65 nuclear staining in tubulointerstitium. *P<0.05 versus the corresponding nondiabetic animals; #P<0.05 for comparison between diabetic Unx-TLR4+/+ and Unx-TLR4−/− mice. (B) Representative renal cortical immunostaining for nuclear phosphorylated NF-κB/p65. Hematoxylin stain; original magnification, ×400. Data represent means ± SD for groups of eight animals.

