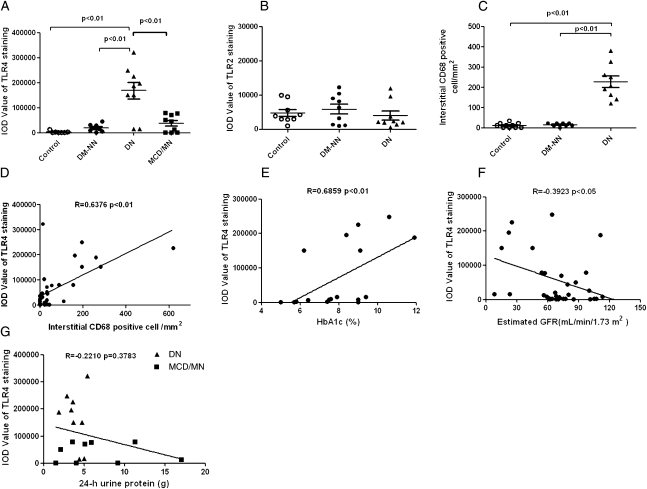
Figure 2.
Quantitative analysis of expression of TLR4 and TLR2 and correlation with CD68+ cell infiltrates in human kidney biopsies. The average IOD of each group was performed by computer-assisted quantitation. (A) TLR4 staining was significantly higher in DN patients (▲; n=9; P<0.01) compared with that in normal controls (○; n=9), DM-NN patients (●; n=9), and MCD/MN patients (▪, n=9). (B) TLR2 staining was similar among DN patients, DM-NN patients, and control subjects (P>0.05). (C) The number of infiltrating CD68+ monocytes/macrophages in the tubulointerstitial area was significantly higher in patients with DN (P<0.01) than in DM-NN patients and normal subjects. (D) Positive correlation between the number of interstitial CD68+ monocytes/macrophages and the intensity of TLR4 staining. (E) Correlation between TLR4 staining and HbA1c in diabetic patients. (F) Negative correlation between TLR4 staining and estimated GFR in all subjects. (G) No correlation between TLR4 staining and 24-hour urine protein excretion among DN and MCD/MN patients.

