Figure 3.
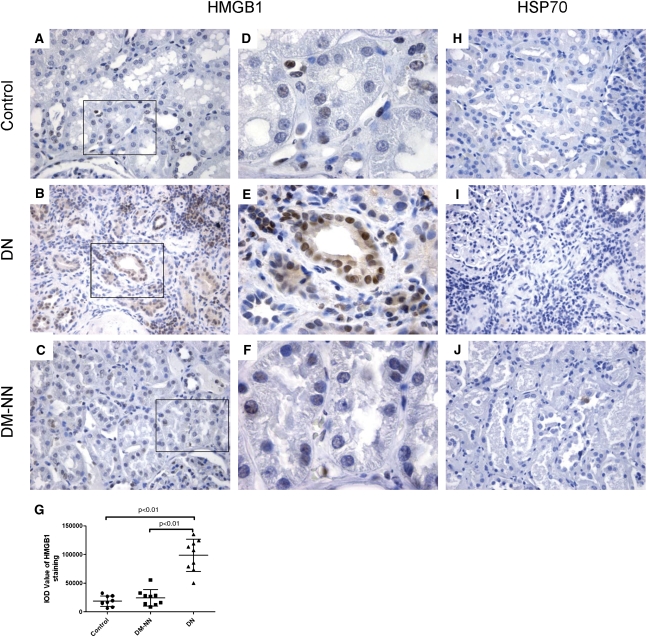
Renal cortical expression of HMGB1 and HSP70 in human biopsies. Representative photomicrographs of HMGB1 staining in human renal cortical tissue from normal subjects (A and D), DN patients (B and E), and DM-NN patients (C and F); HSP70 staining in cortical tissue of normal subjects (H), DN patients (I), and DM-NN patients (J). The average IODs of HMGB1 staining were significantly higher in DN patients than those in normal subjects (P<0.01) and DM-NN patients (P<0.01) (G). Hematoxylin stain; original magnification: ×400 (A–C and H–J); ×1000 (D–F).

