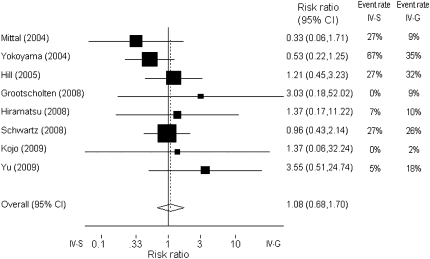
Figure 3.
Forest plot (fixed effects) of the estimated effect of histologic class IV on the risk for renal death. The box size is related to study weights, which were calculated with the Mantel–Haenzel method. A risk ratio >1 suggests a higher risk with class IV-G, and a risk ratio less than 1 suggests a higher risk with class IV-S. The test for heterogeneity was not significant (P=0.45). A forest plot allowing for random effects (using the DerSimonian and Laird method) yielded similar results.

