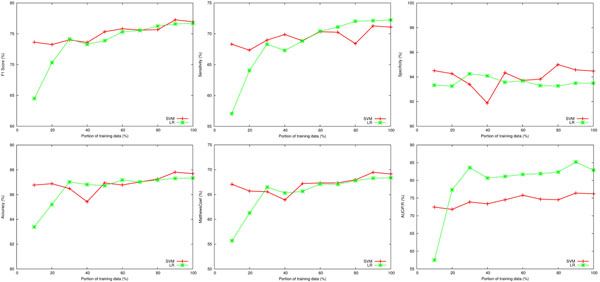
Figure 3.
Learning curves of the ACT systems. Figure 3 shows how the size of training data affected ACT performance. We gradually increased the training size from 10% to 90%. The training data at each percentage point was randomly selected, and then 10-fold cross validations was performed and results plotted.

