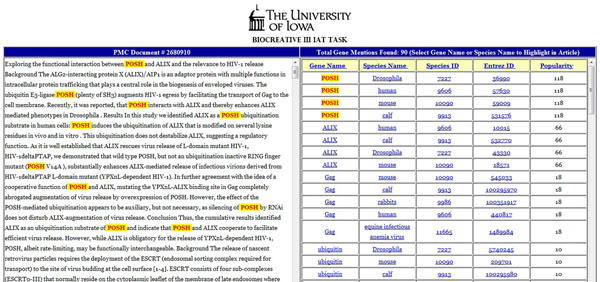
Figure 4.
IAT interface from University of Iowa. The left panel displays the full text of the article selected by the user for the purpose of gene normalization. The right panel shows a ranked list of gene and species names along with their normalized identifiers. In this figure, all instances of the user-selected gene POSH are shown to be highlighted.

