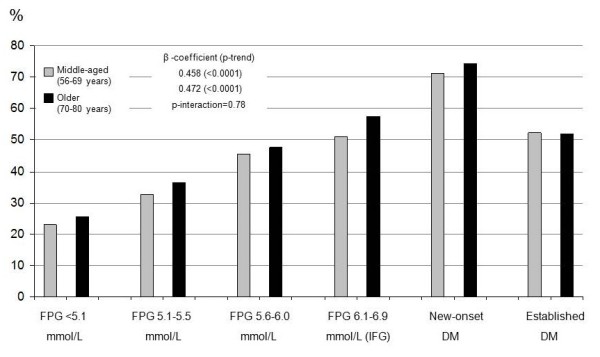
Figure 2.

Proportion of women with three or more risk factors. The figure shows the proportion of women with three or more of the following risk factors: uncontrolled hypertension, dyslipidemia, central obesity, current smoker or being physically inactive; in each of the six glucometabolic status groups defined in the text. β-coefficients and p-values for trends from the 1st to the 5th groups are also shown.
