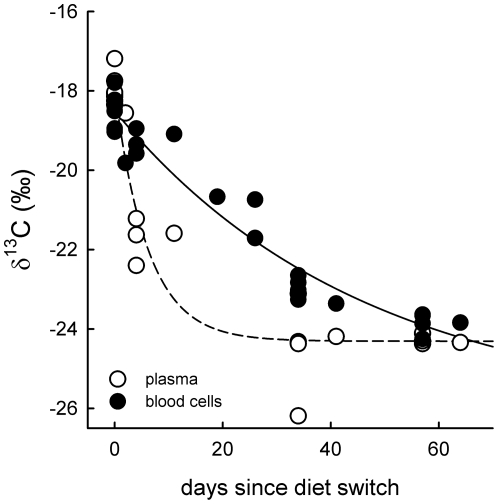
Figure 1. Turn-over of blood tissues.
Turn-over of δ13C in plasma (unfilled circles, dashed line) and blood cells (filled circles, solid line) from mallards switched from C4-based to C3-based diets. For parameters of the exponential decay curves see Table 3.

