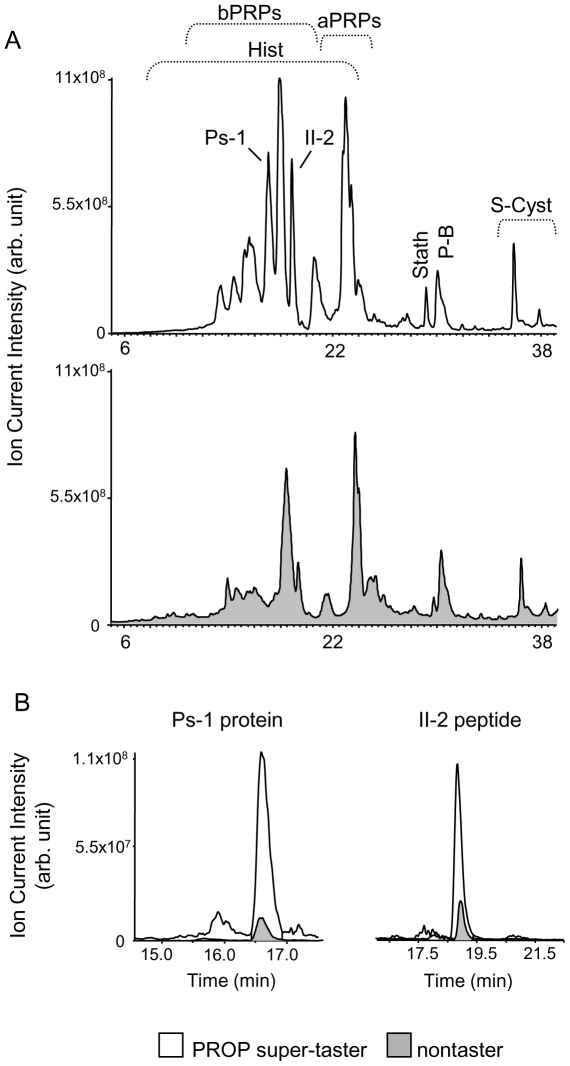
Figure 2. Examples of HPLC-MS profiles from un-stimulated saliva and extracted ion current peaks.
(A) HPLC-MS Total Ion Current (TIC) profiles of the acidic-soluble fraction of saliva of a representative PROP super-taster (white profile) and nontaster (grey profile). (B) The ion current (XIC) peaks of Ps-1 protein and II-2 peptide extracted from the HPLC-MS profiles of the same subjects. The XIC peaks of the PROP super-taster (white filled) are superimposed on the same XIC peaks of the nontaster (grey filled).

