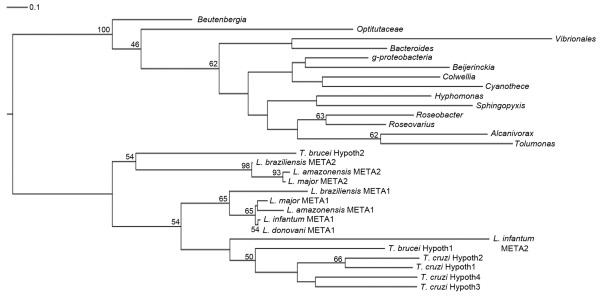
Figure 3.
Phylogenetic relationship between META1 and HslJ. Phylogenetic analysis was done using PhyML [68]. The phylogram represented is a consensus of a 100 bootstrap replicates and is rooted at the basal node. The numbers at the node represent the percentage of trees with the same node among all of the bootstraps. Only bootstrap values ≥ 40% have been mentioned. A horizontal bar marked with 0.1 above the tree represents scale of the generated tree.

